Our Low Risk 12 Month Stock Performance to December 2021 and How to Replicate
- Alpesh Patel
- Dec 13, 2021
- 6 min read

It’s time for the 12-month performance review. As you know, each month, I have a different approved list of stocks for the subsequent 12 months, and starting last year means that we’ve got the 12 months up until the end of November and the start of December 2021.
So how did those 12 months do up until the end of November 2021? How did those stocks do? How did we perform? Well, anybody who knows anything about the markets knows that we had a significant tailwind, so I can’t take credit for everything. So let me share with you in the big reveal. Here we go.

That was the performance, 35.8%. I’ll break down which those shares were, all our holdings, everything else. Those who already follow me on my Telegram channel will know what these stocks are because you got them at the start of last December 2020 because it’s 12 months, remember, to the end of November 2021. And that was the performance.
What was it composed of? Well, let’s look at what it was composed of, and let’s ask the big questions. Why did some stocks go up 100%? Why don’t all of them? And so on.

So these were the top performers of all of those from December 2020 to November 2021, the 12-month period. By the way, I should say, how did that compare to the previous month? So the 12 months preceding that was about 53% up. You’ve seen the videos on that elsewhere. And the month before that, it was very similar to those. It’s 35 point something percent as well.
Of course, the stock names are largely different because as each month goes by, you pick different ones, wouldn’t you? And sometimes, there’s a bit of an overlap. So let’s look at some of the big performers.
Now, why was it that if you're using the same methodology
-> Valuation of this company's earnings
-> Right to their share price
-> Revenue
-> Growth
-> Sales growth
-> Earnings growth
-> Cash flow
-> Cash return on capital explicitly invested
-> Outperformance of the markets
-> Consistency of outperformance of the market
-> Alpha
-> Sortino
Why is it that some stocks did incredibly well using the same methodology, Incap up 259%, Camtek 143%, and so on, but others didn’t do so well? Well, that’s because if we could predict which one was going to be the best performer, we would’ve just put all our money into that.
And that’s an important reason people diversify because they’re not diversifying just in case the markets fall. They’re diversifying because they don’t know which one or two or three stocks will do well, so they need a sufficiently large basket of companies. So how does that performance look?
These are the names of all the ones up over 100%. I’ll give you the complete list, including those that didn’t make a return in a second. And you can see that from a variety of sectors, that’s interesting fact number one, they’re mainly from NASDAQ that we’ve got NYSE and LSE in there as well.

So could you talk about geographies? Well, it’s a mixture of geographies, exchanges, and sectors. So those weren’t the common factors. And you might argue, well, actually, they weren’t the really big, large-cap companies. Yes. That tends to be the case. An elephant doesn’t gallop.
In other words, a billion-dollar company, other than ASM, hardly about to become, or I guess you’ve got more than that. Well, even that’s only 163 million in market cap. Sorry, 16,000. So that is over a billion. And they’ve got 3 billion on Skyline as well. 1.5 billion on Camtek. The rest are all under a billion, except Perficient. So 338 million with the others.
Anyway, have a look at those numbers. And what that tells you is yes, of course, the ones, I guess, if there’s a sweet spot, but you’re reading too much into the data, I think if you’re doing this, without wanting to sound like Professor Witty. Uber is roughly around companies that 100 million. Remember, this is after they’ve got 100% return, maybe 100 million market cap when you’re starting to 200 million, and those are more likely to go up. That could be one argument from the data.
What about the ones which went up 50 to 100%? Still fantastic returns. What do they have in common?
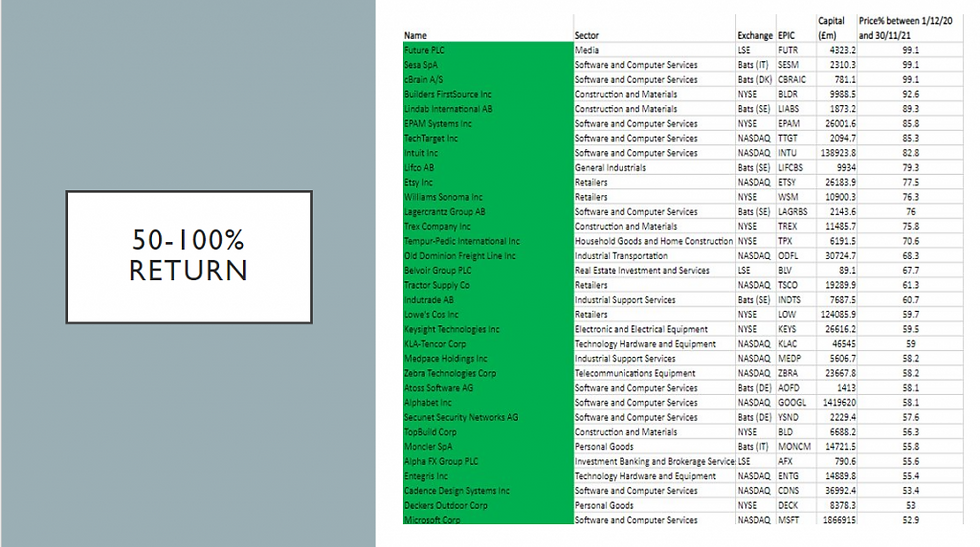
Well, market caps here, you did have quite a few billion-pound companies or billion-dollar companies if you can do the conversion in your head, and is there a sweet spot value there? That’s a bit harder. Is there a sweet spot exchange? That’s a bit harder. Sweet spot sector? Little bit harder. I know you’ll find patterns. Don’t try and look for patterns. It’s human nature where they don’t exist. So be careful about that.
Remember, my approach is valuation growth, income, dividend deals, cash flow, consistency of outperformance, low volatility. All of those factors, I want to tick every single box. I’m not like a forum manager who says, “Oh, anyone UK growth companies or Japanese income companies or US tech companies.” No, I don’t believe in picking from either a narrow gene pool by style, or I don’t believe in being racist in saying I’ll only choose British companies either.
So those are the numbers. Let’s look at the whole performance, including some of the underperformance, the ones that didn’t on that same approach do as well. And this is the distribution curve.

Now what’s interesting here is the numbers you see are how many stocks got between, for instance, 8% to 33%, from 33% to 58%. And you can see and what you want with anything like this is you can see the vast majority, of course, hit the sweet spot, 30%, 40%, 50%. Sadly, you will always have some that underperform got negative returns were loss-making, but those will be few.
And you’ve got a long tail to the right-hand side, which again are some of the outliers. Now you might say so, why don’t you just pick the outliers? Well, I wish we had that kind of time machine. Nobody has one. Nobody on the planet has one. And those who might occasionally get it right and say, “Oh, I picked that one company. That was me,” they probably picked 500 others as well.
So for full disclosure, let’s show you the whole list. That was the entire list from the 1st of December 2020, so 12 months ago, and its 12 months performance subsequently using that approach.

It doesn’t mean we’re still holding them now. In fact, we’re not. We hold for 12 months, and then we redo it. That’s the whole list and how they performed, all the stocks, which are on that list. You can see there are some losers. The losers are few in number. And the losses are small in size relatively.
The winners, a larger number, and the gains are far greater. That’s what you’re looking for. That’s the ideal. To reiterate again, the best way to get that is to have lots of box-ticking, value growth because imagine you just pick one geography. Well, chances are you could have messed up. You might have got lucky for one year, but you won’t keep getting lucky.
That’s why we tick all the boxes and pick from all the geographies and pick the best of the best of the best. It’s common sense, after all. It’s how you hire people in a company. And each one of these companies you might buy shares in are people you are hiring their employees. You’re hiring to look after your pension or your children’s inheritance. So that’s why.
Please have a look at my campaignforamillion.com, where I teach people for free how to invest. You’ll be able to follow me on my LinkedIn channel from there, on my Telegram, on all sorts of social media, download my books, and learn more about investing, all for free. There are free courses that I’ve created, which you can learn more about investing from there.

I hope you like the performance, and I hope it’s also explained why some stocks did go up 100%, why someone went up only 50%, and what we’re going to do to try and replicate that again.
What we’re going to do same again. It’s not the same stocks, same strategy, valuation growth, income, cash flow because if next year the market decides it wants to pick only specific sectors or certain geographies or certain styles like valuation growth, well, we’ll have ticked all those boxes anyway.
So whatever it picks, it’ll be coming into our net, and that way, in one sense, we can’t lose. And I think our returns tend to show that. Yes, the market hadn’t been up yet. Maybe can’t lose is the wrong thing because who knows what the future will hold. There might be a nuclear war in which everyone’s going to lose. I mean the probabilities, and that’s what it’s about, the probabilities of losing at that much lower.

Sign up to www.campaignforamillion.com today

More free resources on www.alpeshpatel.com
Alpesh Patel OBE


Vave sportbetting has really nailed it with their prematch betting platform. It’s intuitive, detailed, and caters to both casual and serious bettors. I’ve found the odds to be very fair, often better than other sites I’ve used. It’s especially helpful that they highlight popular events and provide useful statistics before the match even starts. The site feels professional yet user-friendly, and crypto support is just the cherry on top. If you like to bet with preparation and confidence, this is definitely a section worth checking out.