How to Pick Individual Stocks: The GIP 5-Screen Framework Step by Step
- Alpesh Patel
- Apr 13
- 5 min read

Updated: Apr 20

How to Pick Individual Stocks: A Practical, Evidence-Based Framework
Most investors ask the same question: how to pick individual stocks that actually deliver long-term results?
If you want consistent results, you need a repeatable framework - one that filters out weak businesses and focuses only on those with real cash generation, sensible valuation, and controlled risk.
Here’s a structured way to do it. Every week the GIP framework screens approximately 8,000 publicly listed stocks across global markets. By the time all five filters have run, the list is down to 40–50 stocks. Those are the ones that go on the GIP Approved List. The rest - the other 7,950 or so - have failed at least one test.
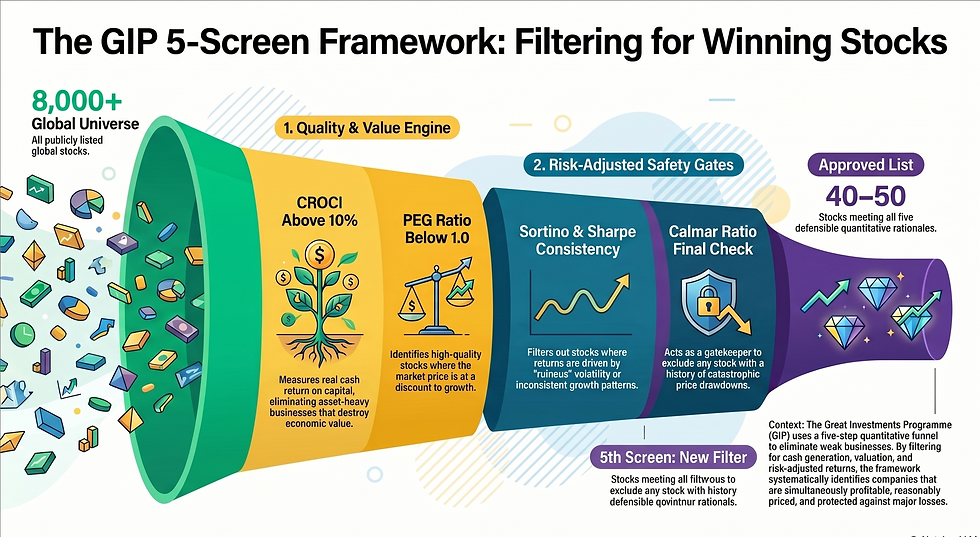
The framework is not a black box. Each of the five screens has a specific, defensible rationale - it is measuring something distinct about the business, and the combination is designed so that passing all five requires a business to be simultaneously profitable, reasonably priced, risk-adjusted, consistent, and drawdown-protected. A stock can look excellent on three screens and disqualify entirely on the fourth.
Alpesh Patel OBE is a hedge fund manager, Bloomberg TV alumnus, Financial Times author, and former Visiting Fellow at Corpus Christi College, Oxford. The GIP framework has been developed and refined over more than two decades of systematic quantitative investing.
Five Key Steps on How to Pick Individual Stocks Screen 1: CROCI Above 10% - Cash Return on Capital Invested
CROCI - Cash Return on Capital Invested was developed by Deutsche Bank's quantitative research team and measures how much real cash a business generates relative to the capital it has deployed. Unlike earnings-based metrics, CROCI uses cash flow rather than accounting profit, making it significantly harder to manipulate and far more representative of genuine economic performance.
The GIP threshold is CROCI above 10%. A business with CROCI of 10% or above is generating meaningful cash returns on the capital it has invested - it is creating economic value, not just accounting value. A business below 10% may be reporting profits while actually destroying capital in real terms. This screen alone eliminates the majority of listed stocks: most capital-heavy businesses (utilities, telecoms, airlines, most industrials) fail this filter. What passes tends to be asset-light businesses with strong pricing power and genuine competitive advantage.
Screen 2: PEG Below 1.0 — Price/Earnings to Growth
PEG divides the P/E ratio by the earnings growth rate. A PEG below 1.0 means the market is pricing the stock at a discount to its growth trajectory - the price is not keeping up with the growth the business is delivering. A PEG above 1.0 means you are paying a premium over justified value. Above 2.0, you are paying a very significant premium.
Peter Lynch used PEG as a core screen during his tenure managing Fidelity Magellan — where he delivered 29% annualised returns over 13 years. The GIP uses PEG below 1.0 as the valuation discipline screen: we want high-quality businesses (CROCI screen) that are not being priced irrationally by the market. This combination - high cash return and reasonable valuation is the engine of the framework.
Screen 3: Sortino Ratio Above 1.0 — Downside Risk-Adjusted Return
The Sortino ratio measures the excess return of a stock relative to its downside deviation - it only penalises negative volatility, unlike the Sharpe ratio which penalises all volatility equally. A Sortino above 1.0 means the stock is generating at least 1 unit of excess return for each unit of downside risk. Below 1.0, the downside risk is not being adequately compensated.
This screen is particularly important for SIPP investors because it directly measures how much of the return profile is composed of the kind of volatility that actually harms the portfolio - price falls. A high-growth stock that falls 40% then recovers 60% looks acceptable on average return but very poor on Sortino. The GIP is not looking for average returns. It is looking for returns that are sustainable and not accompanied by ruinous drawdowns.
Screen 4: Sharpe Ratio - Consistency of Risk-Adjusted Return
The Sharpe ratio measures total excess return per unit of total volatility (both upside and downside). Where the Sortino focuses specifically on downside risk, the Sharpe gives a broader picture of return consistency. In the GIP framework, the Sharpe is used as a consistency check: after passing the Sortino screen (which tells us the downside risk is acceptable), the Sharpe tells us whether the overall risk profile including the upside volatility pattern and is consistent with a business that compounds reliably.
Screen 5: Calmar Ratio - Maximum Drawdown Protection
The Calmar ratio measures annualised return divided by maximum drawdown over the measurement period. A stock that returned 15% per year but had a maximum drawdown of 60% has a Calmar of 0.25 - poor. A stock that returned 15% with a maximum drawdown of 15% has a Calmar of 1.0 - good. The GIP uses the Calmar as the final gatekeeper: even if a stock passes all four previous screens, a catastrophic historical drawdown disqualifies it.
This is particularly relevant for pension investors. A 50% drawdown requires a 100% subsequent gain just to get back to breakeven. For a SIPP investor in their late 50s or in drawdown, a catastrophic drawdown is not just uncomfortable, it is potentially retirement-defining. The Calmar screen systematically excludes stocks with this profile.
Why All Five Together: The Combination Effect
Each screen individually is a useful filter. Together, they create a significantly more powerful selection mechanism. A business can have high CROCI but be expensively valued (fails PEG). A business can have good PEG and CROCI but poor downside protection (fails Sortino and Calmar). A business can have excellent risk metrics but mediocre cash generation (fails CROCI). Only businesses that are simultaneously high-quality, reasonably priced, and risk-disciplined pass all five.
The resulting list of 40–50 stocks changes week to week as market prices move and company fundamentals are updated. Stocks that no longer meet the criteria drop off. New entrants are added. The quarterly review process checks which holdings have fallen below threshold and replaces them. This keeps the portfolio aligned with the framework at all times, rather than drifting into holdings that no longer qualify.
To see the current GIP Approved List applied to your own SIPP or ISA, book a free portfolio review here
Sources & Further Reading
Deutsche Bank Quantitative Research — CROCI framework, methodology, and application to stock selection. db.com
Lynch, P. (1989) — One Up on Wall Street. Original exposition of the PEG ratio as a practical stock selection tool.
Sortino, F. and van der Meer, R. (1991) — 'Downside Risk'. Journal of Portfolio Management. Original paper on downside deviation as a more relevant risk measure than standard deviation.
Sharpe, W. (1966) — 'Mutual Fund Performance'. Journal of Business. Original paper on risk-adjusted return measurement.
Disclaimer: This article is for educational purposes only. The GIP framework is a systematic screening tool, not a guarantee of future returns. All investing carries risk. Past performance is not a reliable indicator of future results. This does not constitute personal financial guidance.
Alpesh Patel OBE


Comments