Monte Carlo Simulation for Retirement Planning: What It Is and Why Your Pension Provider Doesn't Use It
- Alpesh Patel
- Apr 6
- 5 min read

Updated: Apr 20

When your pension provider sends you an annual benefit statement, it shows you a projection. A single number. One future. Usually based on 5% annual growth, sometimes 2% and 8% as lower and upper scenarios.
The problem is that reality does not work like that. Markets do not deliver 7% every year. They deliver 23% one year, -18% the next, 12% the year after. The sequence of those returns when they arrive, in what order matters enormously to the actual outcome for a real investor making real contributions and real withdrawals over a real working life.
Monte Carlo simulation addresses this by running thousands of possible futures simultaneously. Rather than projecting a single outcome at an assumed growth rate, it generates a probability distribution of outcomes based on the statistical properties of asset returns - their average, their volatility, and the correlations between them. The result is a range of possible futures with their associated probabilities: there is a 90% chance your pot will be above £X, a 50% chance it will be above £Y, and a 10% chance it will be above £Z.

Alpesh Patel OBE is a hedge fund manager, Bloomberg TV alumnus, Financial Times author, and former Visiting Fellow at Corpus Christi College, Oxford. Monte Carlo simulation is used in GIP client reviews to model retirement outcome probability distributions across different contribution rates, growth assumptions, and withdrawal scenarios.
How Monte Carlo Simulation Works
Monte Carlo simulation is named after the Monaco casino district - a reference to the role of random chance in the method. It was developed in the 1940s by mathematicians John von Neumann and Stanislaw Ulam for nuclear weapons modelling and has since become a foundational tool in financial planning, risk management, and scientific research.

In retirement planning, Monte Carlo works as follows:
Define the inputs: starting pot size, planned contributions, expected retirement date, planned withdrawal rate, asset allocation, and the statistical properties of the assets (mean return, standard deviation, and correlations).
Run the simulation: the model randomly generates thousands of possible return sequences for the asset portfolio, each drawn from the statistical distribution of historical returns. Each simulation produces a different path for the portfolio value over time.
Read the output: the distribution of outcomes across thousands of simulations gives you the probability of different retirement scenarios. A 90% success rate means that in 90 out of 100 simulated futures, the portfolio sustains the planned withdrawals for the full retirement period.
Why a Single Projection Is Dangerously Misleading
The FCA mandates that pension providers issue projections at standardised growth rates - currently 2%, 5%, and 8% — as part of their annual statements and Key Features Documents. These projections assume the same return every year for the entire projection period. They do not model:
Return volatility: the fact that markets go up and down, not in a straight line
Sequence of returns risk: the critical impact of the order in which returns arrive
Inflation variability: the fact that real returns fluctuate independently of nominal ones
Longevity risk: the real possibility of living significantly longer than the projection assumes
A pension projection showing £540,000 at retirement at 5% growth per year sounds reassuring. A Monte Carlo analysis of the same inputs might show that £540,000 is the median outcome but with a 20% probability of ending up below £310,000 due to bad sequence of returns, and a 10% probability of exceeding £890,000. The projection conceals the range. The Monte Carlo reveals it.
How Monte Carlo Is Used in GIP Client Reviews
In GIP portfolio reviews, Monte Carlo simulation is used in three ways:
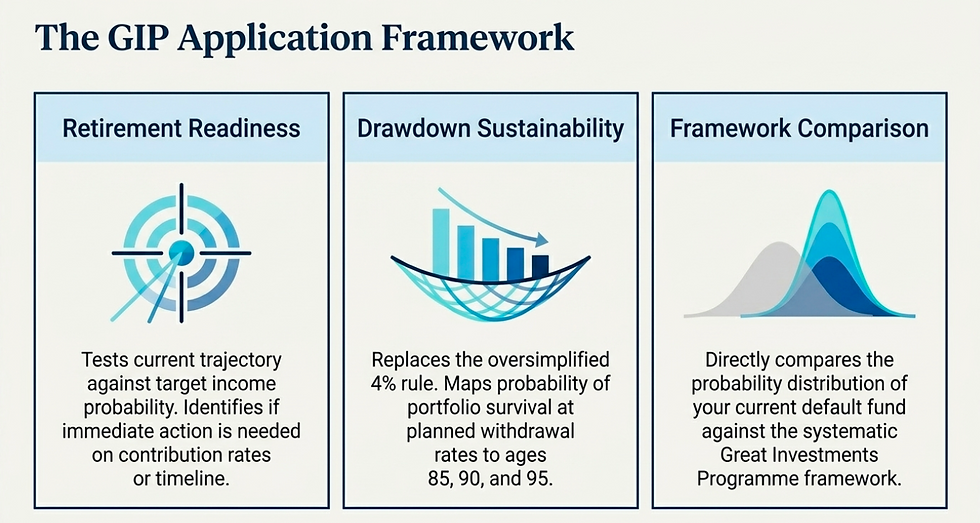
Retirement readiness assessment: Given the client’s current pot, planned contributions, and target retirement date, what is the probability of reaching the target income at different return assumptions? This is used to identify whether the current trajectory is sufficient or whether action is needed on contribution rate, retirement date, or investment approach.
Drawdown sustainability: At the planned withdrawal rate, what is the probability of portfolio survival at different ages =-85, 90, 95? This is the core tool for drawdown planning, replacing the dangerously oversimplified 4% rule with a probabilistic assessment tailored to the specific client’s pot, allocation, and withdrawal level.
Framework comparison: Comparing the probability distribution of outcomes under the current default fund vs the GIP framework. This is the most compelling visualisation of the value of a systematic investment approach — not just the median outcome improves, but the 10th percentile outcome (the worst realistic case) also improves materially, because better risk-adjusted returns mean the lower tail of the distribution shifts upward.
Frequently Asked Questions: Monte Carlo Simulation
What is Monte Carlo simulation in retirement planning?
Monte Carlo simulation runs thousands of possible future return scenarios, each randomly drawn from the statistical distribution of historical asset returns, and calculates the portfolio outcome for each. The result is a probability distribution of retirement outcomes: how likely it is that the portfolio reaches a given value or sustains a given income level for a given number of years.
Why don't pension providers use Monte Carlo simulation?
The FCA prescribes a standardised projection methodology for consumer pension communications — fixed growth rates at 2%, 5%, and 8% — to ensure comparability across providers. This regulatory standardisation prevents providers from using Monte Carlo in their standard statements, even though Monte Carlo gives a more complete picture of risk. Regulated financial planners and tools like those used in GIP client reviews use Monte Carlo simulation as a supplement to, or replacement for, the FCA standard projection.
What is a good Monte Carlo success rate for retirement?
Financial planners typically target 85–95% success rate in Monte Carlo retirement analysis. A 90% success rate means that in 90 out of 100 simulated futures, the portfolio sustains the planned withdrawals for the full projection period (typically to age 90 or 95). A success rate below 75–80% is generally considered a significant retirement risk signal that warrants action — either on contribution rate, withdrawal rate, retirement date, or investment approach.
Where can I run a Monte Carlo simulation for my pension?
Free online tools include Portfolio Visualizer (portfoliovisualizer.com), which runs Monte Carlo for custom portfolios. The FCA's Pension Calculator provides standardised projections. For a Monte Carlo analysis tailored to your specific GIP portfolio, contribution history, and retirement timeline, this is covered in the GIP portfolio review process. Book a free review at the link below.
Does Monte Carlo simulation make the 4% rule obsolete?
Not obsolete, but it contextualises it much more usefully. The 4% rule — derived from Bengen’s 1994 research on US historical returns — provides a starting point for sustainable withdrawal rate. Monte Carlo shows how that withdrawal rate performs across thousands of possible futures, not just the historical average. For a GIP portfolio targeting 13% gross return, a 4% withdrawal rate typically shows a very high Monte Carlo success rate. For a default fund at 7%, the same 4% withdrawal rate shows a materially lower success rate over a 30-year retirement.
For a Monte Carlo analysis of your own retirement trajectory — including the probability distribution of outcomes under your current pension and under the GIP framework — book a free portfolio review here.
Sources & Further Reading
Bengen, W.P. (1994) — 'Determining Withdrawal Rates Using Historical Data'. Journal of Financial Planning. Original 4% rule research; the foundation for Monte Carlo validation in retirement planning.
Pfau, W. (2010) — 'An International Perspective on Safe Withdrawal Rates'. Journal of Financial Planning. Extension of Bengen’s work using Monte Carlo across international markets.
Portfolio Visualizer — Free Monte Carlo simulation tool for custom portfolio analysis. portfoliovisualizer.com
Financial Conduct Authority — Pension projection methodology and standardised growth rate requirements. fca.org.uk
Financial Times — Monte Carlo simulation in financial planning and retirement income analysis. ft.com/personal-finance
Disclaimer: This article is for educational purposes only. Monte Carlo simulations are probabilistic models, not guarantees. All investing carries risk. Past performance is not a reliable indicator of future results. This does not constitute personal financial guidance.
Alpesh Patel OBE


Comments