Retirement Compounding and Sequence Risk: 5 Uncomfortable Truths the Numbers Don’t Lie About
- Alpesh Patel
- Feb 4
- 4 min read

Introduction: Why Most Retirement Plans Fail Quietly
Most people spend decades arguing about pension fees, tax wrappers, or which provider has the slickest app. Those details matter but they are not what determines whether a retirement plan actually survives.
The real drivers of success are mathematical forces that don’t care about opinions, marketing, or comfort.Two dominate everything else:
Pre-retirement compounding
Post-retirement sequence risk
Ignore them, and your plan may look fine on a spreadsheet, right up until it collapses in real markets.
This article breaks down five uncomfortable truths about retirement compounding and sequence risk, using clear numbers, real scenarios, and visual evidence to show what actually separates fragile retirements from financially resilient ones.
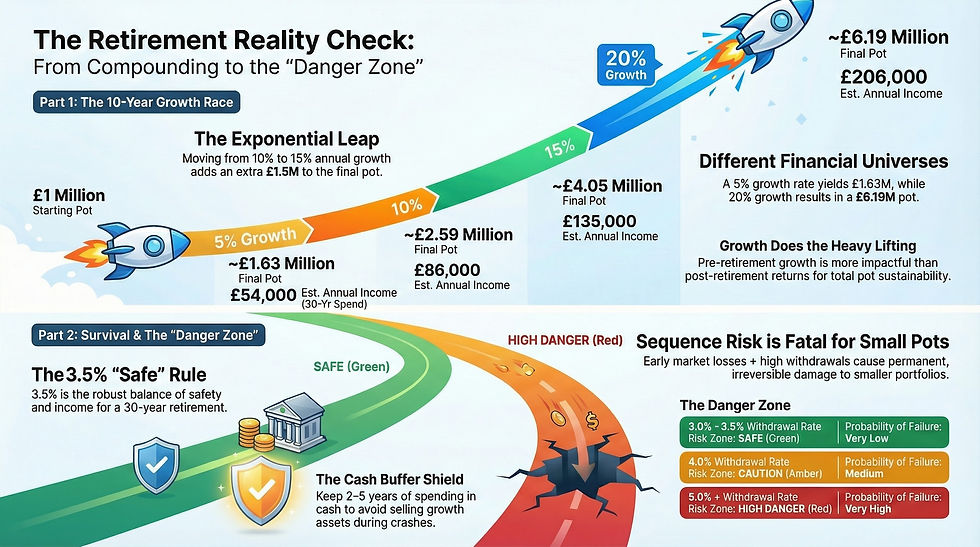
Truth #1: The Decade Before Retirement Determines the Next 30 Years
Compounding Is Exponential - Not Linear
The most powerful period in your entire financial life is the final 10 years before retirement. This is when compounding stops being subtle and becomes decisive.
Using a £1,000,000 starting pot with 10 years to retirement and no additional contributions:
Annual Growth Rate | Pot After 10 Years |
5% | ~£1.63 million |
10% | ~£2.59 million |
15% | ~£4.05 million |
20% | ~£6.19 million |
The leap from 10% to 15% growth doesn’t sound dramatic but it adds £1.5 million.
These are not “slightly different” outcomes.They are entirely different financial universes.

Truth #2: Market Crashes Don’t Hit Everyone Equally
Sequence Risk Is a Size Problem, Not a Market Problem
Sequence risk occurs when:
Early market losses + withdrawals = permanent damage
What most investors miss is this:Sequence risk does not affect all retirees equally.
It is fatal to small or marginal pots and merely inconvenient for large ones.
Stress-test outcomes after a bad first five years:
£1.6m pot High probability of running out of money Withdrawal rate explodes after losses Classic “looked fine on a spreadsheet” failure
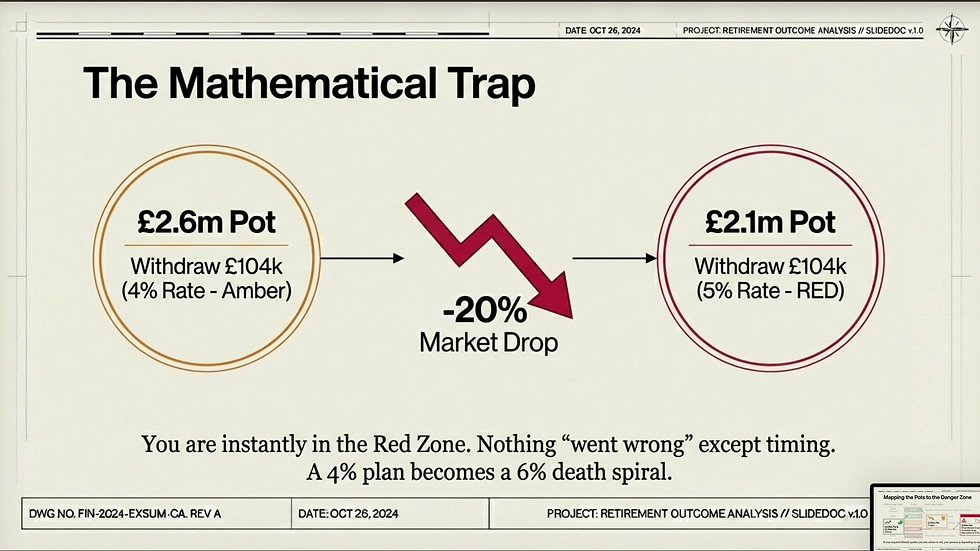
£2.6m pot Survivable, but fragile One extra shock (inflation, care costs) causes cuts
£4.0m pot Withdrawals remain manageable Sequence risk becomes controllable
£6.2m pot Portfolio barely notices the crash Withdrawal rate stays below danger thresholds
Sequence risk destroys small pots. It barely touches large ones.


Truth #3: Your Income Can Push Your Pension Into the Danger Zone
The Retirement Danger Zone Dashboard
Retirement sustainability depends on one simple metric:Your withdrawal rate after a market fall, not before it.
Withdrawal Rate | Risk Zone | Reality |
3.0%–3.5% | Green | Capital usually survives |
4.0% | Amber | Works in average markets |
4.5% | Red | Cuts likely after crashes |
5.0%+ | Dark Red | One crash can be fatal |
6.0%+ | Failure | Running out of money is likely |
Here’s the trap: A 4% plan becomes a 6% plan overnight after a market drop.
Nothing “went wrong”. The math changed.
If your lifestyle requires amber or red-zone withdrawals, your retirement depends on luck, not planning.

Truth #4: You Survive Crashes With Structure, Not Higher Returns
Why Cash Buffers Beat Return Chasing
When markets fall, investors instinctively look for higher returns.That instinct is usually fatal.
The real defence is structure, not performance.
A cash buffer (typically 2–5 years of spending) allows you to:
Fund living costs during crashes
Avoid selling growth assets at the worst time
Reduce forced-sale withdrawals to zero
Example: A £2.6m portfolio withdrawing £104,000 per year:
Without buffer Crash pushes withdrawal rate into danger Forced selling locks in losses
With a 3-year buffer Spending comes from cash Growth assets recover untouched
You didn’t beat the market. You just didn’t sabotage yourself.

Image to use here
“The Cash Buffer Defense”
“Buffer Mechanism in Action: With vs Without”
Truth #5: Fixed Cash Percentages Are a Dangerous Myth
Years of Spending Matter - Not Percentages
Rules like “hold 10% in cash” are mathematically flawed.
Why? Because buffer needs scale inversely with pot size.
Pot Size | Recommended Buffer |
£1.5m–£2.0m | 4–5 years |
£2.5m–£3.0m | 3–4 years |
£4.0m–£5.0m | 2–3 years |
£6.0m+ | 1.5–2 years |
A 10% buffer:
Is dangerously small for fragile pots
Is an unnecessary drag for large ones
Cash buffers exist for survival, not returns.

Conclusion: From Luck to Financial Freedom
A retirement plan is already broken if it depends on:
No early market crashes
Perfect investor behaviour
No unexpected expenses
True financial freedom comes from:
Maximising pre-retirement compounding
Controlling sequence risk
Building defensive structure, not hopeful projections
The question isn’t whether markets will fall.They always do.
The real question is: Will your retirement survive reality or does it rely on luck?
How Campaign for a Million Helps
At Campaign for a Million, the focus is not on selling products or chasing headlines but on investor education.
The tools and insights available on the platform are designed to help investors:
Understand real-world pension risks
Model sustainable income
Think independently rather than blindly trusting providers
👉 Explore investor education tools here: https://www.campaignforamillion.com/tools
Disclaimer: This article is for educational purposes only and does not constitute financial advice, investment advice, or a personal recommendation.All investing involves risk, including the potential loss of capital. Past performance and hypothetical examples are not guarantees of future results. Withdrawal rates, growth assumptions, and scenarios are illustrative and may not reflect individual circumstances. Always consider seeking independent, regulated financial advice before making investment or retirement decisions. Alpesh Patel OBE

Comments