Why We Lean on Data, Not Narrative - or You May Hear the Titanic
- Alpesh Patel
- Aug 22, 2025
- 3 min read

Updated: Sep 25, 2025
Let’s be blunt: stories make money. They feel compelling because they’re built on emotion, deft metaphors, and memorable characters. But in finance, emotion is the worst counsellor you could hire. That’s why in the Great Investments Programme (GIP), we always choose data over drama - because numbers don’t lie, but storytellers often do.
Take this did - you-know from Clearer Thinking: they teach statistics through the Titanic disaster - mean, median, correlation, p‑values, regression. You name it- applied to who survived and who didn’t. That’s not just clever; it’s proof of how contextless narratives fool us, while data saves us (Clearer Thinking).
Example 1: The 1% Fee Mirage
Your IFA might argue, “1% is modest,” projecting 5% returns and conveniently burying the fact you’re handing over 20% of your profits every year. Sounds innocent - until you model it. At 5% gross on a £500k portfolio, that’s £25k. Take out the 1% adviser fee, and you keep just £20k. Over 20 years, you’ve surrendered six figures to someone who may not even outperform the market. That’s not realistic - it’s robbery by narrative.
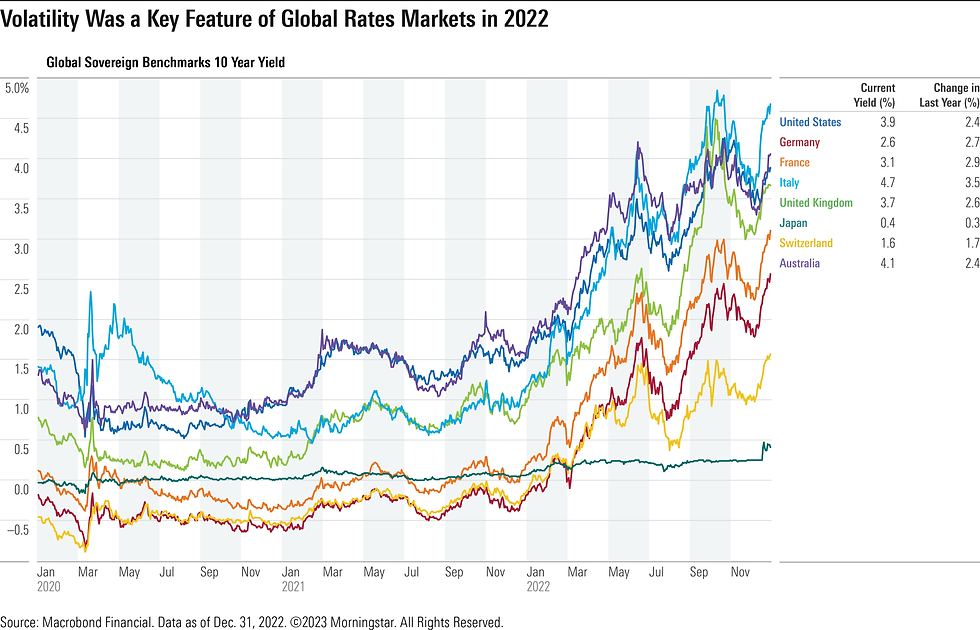
Charts like these from Morningstar help us see not just what a portfolio earned, but how much of that return fees quietly consumed.
Example 2: Titanic Statistics, Not Anecdotes
Remember, median age on the Titanic might differ meaningfully from mean age; using the wrong measure distorts reality. That’s not nitpicking - that’s accuracy.

Similarly, our GIP analyses rely on the right statistical tools: we test distributions, significance, p‑values, correlations. We don’t just tell you “it worked”; we show you how likely that working wasn’t just luck.
A chart beats a compelling anecdote every time. When we illustrate portfolio outcomes using Monte Carlo simulations - or overlay fee drag on net wealth curves - we’re giving you the mathematical truth: not one investor’s feel‑good story, but distributional probabilities and outcomes.
Example 3: The Sample-Size Fallacy
Consider promoters who boast of “one client who doubled in 3 years.” Sounds flashy. But is it repeatable? Without knowing sample size, variation, or risk, you’re listening to a headline, not an honest broker. GIP uses statistically valid samples, confidence intervals, and back-tested models - built for reliability, not hype. Our goal is that your reading, your investing, your risk decisions are always evidence‑driven.
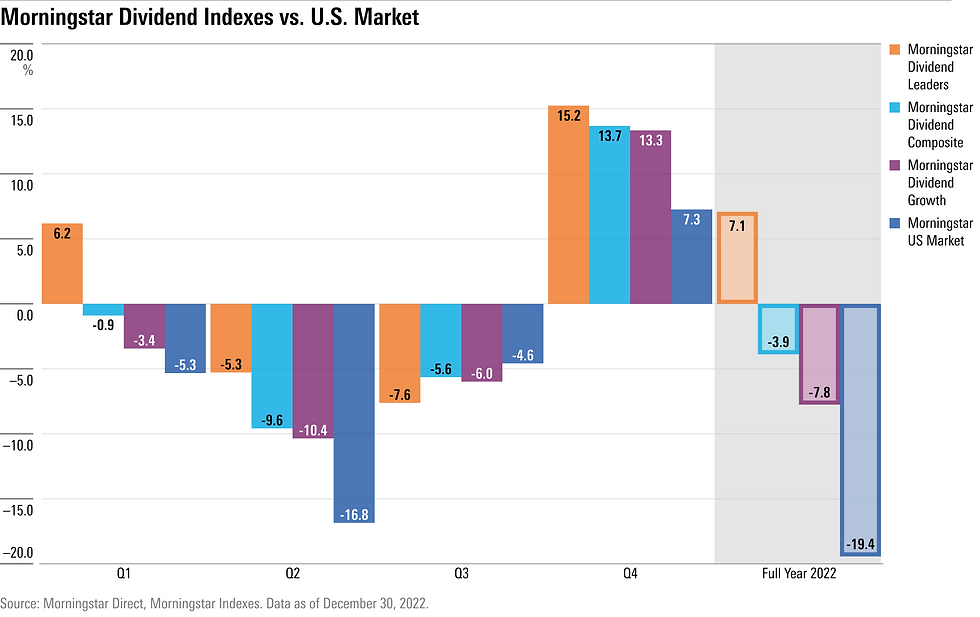
Visualising return distributions:
Knowledge Is Power (and Profit)
In the game of compounding, narratives are the noise that kills returns. Statistics - the correct metrics, the right models - are the tools that empower you to invest smarter, not feel smarter. At GIP, we teach you to read the raw data, not the marketing copy. Because financial freedom flows from numbers you control - not the story someone sells.
Disclaimer: The information provided in this article is for educational purposes only and does not constitute investment advice, recommendation, or an offer to buy or sell any financial product. Past performance is not a reliable indicator of future results. The value of investments can go down as well as up, and you may not get back the amount originally invested. Always consider your individual circumstances and, if necessary, seek independent financial advice before making investment decisions. Alpesh Patel OBE


Comments