Does the FTSE 100 Ever Beat the S&P 500? A Data-Driven Reality Check
- Alpesh Patel
- Dec 14, 2025
- 4 min read

Updated December 2025
Many UK investors assume the FTSE 100 regularly competes with U.S. markets. The data tells a very different story.

While the FTSE 100 has enjoyed occasional strong years, its long-term performance especially compared with the S&P 500 has been structurally weaker.
This article examines when the FTSE does outperform, how often that happens, and what the long-term numbers reveal for investors allocating capital today.
FTSE 100 Calendar Years with >20% Gains
Since its inception in 1984, the FTSE 100 price index has recorded annual gains above 20% in only six calendar years, based on data available up to 2024.
Those years were 1984, 1989, 1993, 1995, 1997, and 2009, with price returns ranging from just over 20% to as high as approximately 35%.
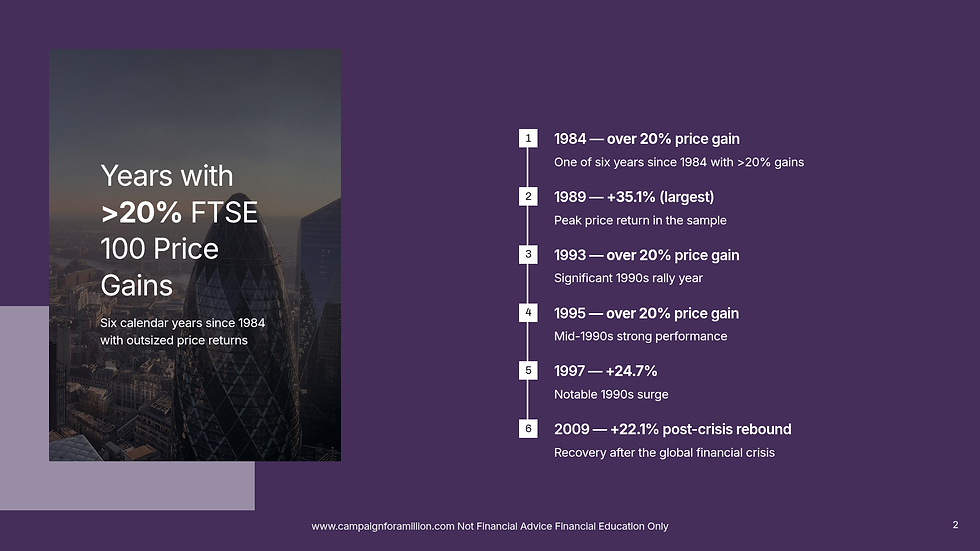
For example, the FTSE 100 surged by 35.1% in 1989 and by 24.7% in 1997, both of which comfortably exceeded the 20% threshold.
In 2009, the index rebounded by 22.1% following the downturn caused by the Global Financial Crisis.
As a current observation, 2025 is also on track for a gain of more than 20% for the FTSE when dividends are included, with the index up approximately 22% by early December 2025 at the time of writing.
Frequency of FTSE Outperformance vs U.S. Indices
Next, it is useful to consider how often the FTSE 100’s yearly price return has outpaced each of three major U.S. stock indices' the Nasdaq Composite, the Dow Jones Industrial Average, and the S&P 500 on a calendar-year basis. Because the FTSE 100 was launched in 1984, comparisons are made from 1984 onward.

Against the Nasdaq Composite:The FTSE 100 outperformed the Nasdaq Composite in 14 out of 41 years from 1984 through 2024, which is approximately one-third of the time.
Notable instances of this outperformance occurred during the late 1980s and the early 2000s bear markets. For example, between 2000 and 2002, the FTSE’s smaller declines meant it “outperformed” the Nasdaq, which experienced much steeper losses during the technology crash.
Overall, the years in which the FTSE outperformed the Nasdaq were 1984, 1987–1988, 1989–1990, 1993, 1997, 2000–2002, 2005–2006, 2008, 2016, and 2022, for a total of 14 years.
Against the Dow Jones Industrial Average:The FTSE outgained the Dow Jones Industrial Average in 11 out of 41 years, or approximately 27% of the time.
Examples include 1984, when the FTSE rose by 23% while the Dow fell by 3.7%, and 2008, when both indices declined sharply but the FTSE’s 31% fall was slightly less severe than the Dow’s 34% decline.
Other years in which the FTSE outperformed the Dow were 1984, 1989, 1992–1993, 1997, 2004–2005, 2008–2009, 2016, and 2022. In all other years, the Dow’s price return exceeded that of the FTSE.
Against the S&P 500:The FTSE 100 outperformed the S&P 500 in 10 out of 41 years, or roughly 24% of the time.
For instance, in 1986 the FTSE returned 18.9% compared with the S&P 500’s 14.6%, while in 2005 the FTSE gained 16.7% versus the S&P 500’s 3.0%.
In contrast, during strong U.S. bull market years such as 1995, 2013, and 2019, the S&P 500’s gains far surpassed those of the FTSE, resulting in clear FTSE underperformance.
Overall, the FTSE has beaten the S&P 500 in roughly one out of every four calendar years since 1984.
FTSE 100 vs S&P 500 Streaks
Streaks of consecutive FTSE outperformance relative to the S&P 500 have been infrequent and usually isolated. In fact, only two multi-year streaks appear in the USD-adjusted data.
The FTSE 100 managed to outperform the S&P 500 for three consecutive years from 1986 to 1988. This period coincided with a strengthening pound and included the 1987 U.S. stock market crash.
The only other instance was a two-year streak in 2007 and 2008, when the FTSE outperformed during the onset of the Global Financial Crisis. This was supported by a strong pound in 2007 and a slightly smaller market decline in 2008.
Aside from these cases, whenever the FTSE has beaten the S&P 500 in a given year, it has typically failed to repeat that outperformance in the following year.

In other words, FTSE outperformance has tended to be short-lived, with no extended periods of sustained dominance beyond the episodes noted above.
CAGR (2008–2025) for FTSE 100 vs S&P 500 (Price Only)

Finally, longer-term growth provides a clearer comparison. Using price-index levels and excluding dividends, the compound annual growth rate of the FTSE 100 from the start of 2008 through the end of 2024 has been extremely modest, at approximately 1.4% per year.
The FTSE 100 closed at 6,456.91 at the end of 2007 and rose to 8,173.02 by the end of 2024. Over this 17-year period, the index gained roughly 26% in total, which corresponds to an annualised return of about 1.4% when compounded.
In stark contrast, the S&P 500 price index roughly quadrupled over the same period. It closed at 1,468.36 on 31 December 2007 and increased to 5,881.63 by 31 December 2024, representing a total gain of approximately 300%.
In summary, since 2008 the U.S. market’s price appreciation has vastly outpaced that of the UK. The S&P 500’s annual growth rate over this period was around six times higher than that of the FTSE 100. This highlights the FTSE 100’s comparatively stagnant performance, particularly when viewed in U.S. dollar terms.
As many analysts have noted, the FTSE 100’s price level at the end of 2019 was barely above where it had been twenty years earlier, underscoring the long-term underperformance of UK equities relative to U.S. markets.
What This Means for Investors
The evidence is clear. The FTSE 100 can deliver strong years, but they are rare. Outperformance versus U.S. markets occurs infrequently, and when it does, it tends to be short-lived.
For long-term investors, this reinforces the importance of avoiding home bias and thinking globally when constructing portfolios. Compounding rewards consistency, breadth, and exposure to structural growth, not loyalty to a domestic index.
Disclaimer: This article is for educational purposes only and does not constitute investment advice. Past performance is not indicative of future results. Investors should consider their objectives and seek independent advice where appropriate. Alpesh Patel OBE www.campaignforamillion.com


Comments