The Sharpe Ratio Explained: How to Measure Return Against Total Risk
- Alpesh Patel
- Mar 26
- 6 min read

Updated: Apr 11
If someone asks how well a fund or a stock has performed, the answer almost always involves returns. But returns without context are meaningless. A 20% return is excellent if it was achieved with modest, consistent price movements. It is considerably less impressive if it required enduring a 50% drawdown along the way.
The Sharpe ratio was developed specifically to address this problem. It adjusts return for the risk taken to achieve it, producing a single number that allows meaningful comparison between investments with very different risk profiles. It is the foundational risk-adjusted return metric in institutional investment management — used by fund managers, pension trustees, and quantitative analysts worldwide.
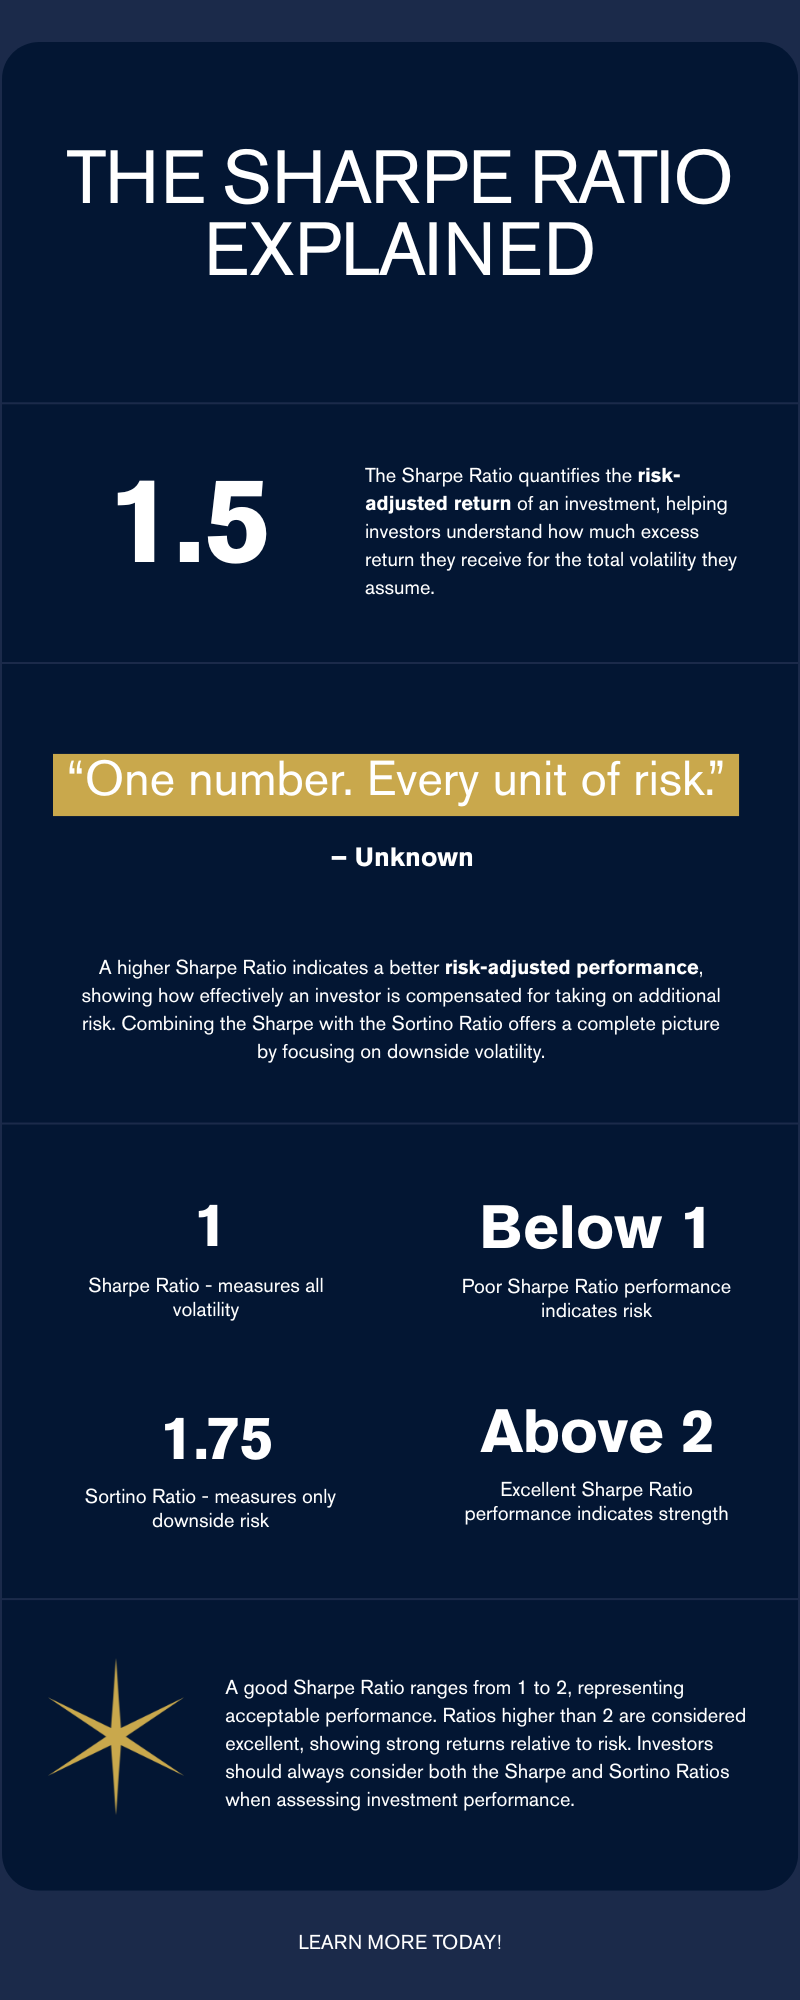
The GIP framework includes the Sharpe ratio as one of its five quantitative screens — not as the primary risk measure, but as a complement to the Sortino ratio, which focuses specifically on downside risk. Together, the two ratios give a complete picture of risk-adjusted return that neither can provide alone.
Alpesh Patel OBE is a hedge fund manager, Bloomberg TV alumnus, Financial Times author, and former Visiting Fellow at Corpus Christi College, Oxford. The Sharpe ratio is one of five quantitative metrics at the core of the Great Investments Programme framework.
What the Sharpe Ratio Measures
The Sharpe ratio was developed by Nobel Prize-winning economist William F. Sharpe and first published in the Journal of Business in 1966 under the title 'Mutual Fund Performance'. Its core insight is simple: investors should not be rewarded merely for taking risk. They should only be rewarded for risk that is compensated by return above the risk-free rate.
The formula is: Sharpe Ratio = (Portfolio Return − Risk-Free Rate) ÷ Standard Deviation of Returns

The risk-free rate is typically the yield on UK government gilts or the Bank of England base rate — the return an investor could earn with zero risk. Standard deviation measures total volatility: how much the investment's returns fluctuate around the average, in both directions.
A Sharpe ratio of 1.5 means the investment delivered 1.5 units of excess return for every unit of total risk taken. A Sharpe ratio of 0.4 means it barely rewarded the investor for the volatility they endured.
What Is a Good Sharpe Ratio?
Below 1.0: Poor. The investment is not adequately compensating for its total volatility.
1.0 to 2.0: Good. The investment provides a meaningful excess return per unit of risk — in line with or above most actively managed funds.
Above 2.0: Excellent. The investment delivers high returns relative to its volatility. Sustained Sharpe ratios above 2.0 are rare and indicate an unusually efficient risk-return profile.
Above 3.0: Exceptional. Rare in equity investing over full market cycles. More common in carefully constructed alternatives portfolios or in specific factor-based strategies during favourable periods.
For context: the MSCI World Index has historically produced a Sharpe ratio of approximately 0.4–0.6 over rolling 10-year periods. The S&P 500 has historically produced a Sharpe ratio of approximately 0.5–0.7. A well-managed equity fund consistently producing a Sharpe ratio above 1.0 is genuinely distinguishing itself from the market.
A Practical Example: Two Portfolios, Same Return
Consider two investors, both achieving a 12% annualised return over five years, with a risk-free rate of 4.5%:
Investor A: Returns of 12% with a standard deviation of 8%. Sharpe = (12 − 4.5) ÷ 8 = 0.94. Reasonable but not exceptional.
Investor B: Returns of 12% with a standard deviation of 20%. Sharpe = (12 − 4.5) ÷ 20 = 0.375. The same return, but achieved through a far more volatile path with a Sharpe ratio that barely clears 0.4.

Investor A achieved the same return as Investor B while taking less than half the total risk. On a Sharpe-ratio basis, Investor A's portfolio is dramatically superior — even though the raw return is identical. This is the insight the Sharpe ratio provides that raw returns cannot.
Why the GIP Framework Uses Both Sharpe and Sortino
The Sharpe ratio's limitation is that standard deviation captures both upside and downside volatility. A stock that repeatedly delivers exceptional positive returns will have high standard deviation, and the Sharpe ratio will penalise it even though that upside volatility is exactly what investors want.
This is why the GIP framework pairs Sharpe with Sortino. The Sortino ratio uses only downside deviation in its denominator, making it a purer measure of investor-relevant risk.

Together, the two ratios answer complementary questions: the Sharpe ratio asks 'how efficiently is this investment generating return per unit of total volatility?', while the Sortino ratio asks 'how efficiently is it generating return per unit of downside volatility specifically?'
A stock that passes both screens is demonstrating strong risk-adjusted performance on both the total volatility basis (Sharpe) and the downside-specific basis (Sortino). A stock that passes Sharpe but fails Sortino typically has excessive downside volatility that is being masked by equally strong upside swings. A stock that passes Sortino but fails Sharpe is more unusual — typically a consistently positive but not particularly high-returning business. Both metrics are in the framework for good reason.
The Sharpe Ratio in the Context of the GIP Five-Metric Framework
The five GIP screens work as a combined filter: CROCI above 10% (cash generation quality), PEG below 1.0 (valuation relative to growth), Sortino above 1.0 (downside risk-adjusted return), Sharpe (total risk-adjusted return), and Calmar (return relative to maximum historical drawdown). A stock must pass all five to appear on the GIP Approved List.
The Sharpe and Sortino screens together function as the risk-adjusted return gate. CROCI and PEG are the quality and valuation gate. Calmar is the drawdown protection gate. No single metric is sufficient on its own — it is the combination that systematically identifies businesses that are high quality, reasonably priced, and have exhibited resilient, efficient price behaviour over time.
Frequently Asked Questions: The Sharpe Ratio
What is a good Sharpe ratio for a stock portfolio?
For an equity portfolio, a Sharpe ratio above 1.0 is considered good — materially above the historical Sharpe of the broad market (0.4–0.7). Above 2.0 is excellent and rare over sustained periods. The GIP Approved List targets stocks with Sharpe ratios in the strong range, combined with Sortino above 1.0, to identify consistently efficient risk-return performers.
Who invented the Sharpe ratio?
The Sharpe ratio was developed by William F. Sharpe, an American economist and Nobel Memorial Prize laureate in Economic Sciences (1990). He introduced it in his 1966 paper 'Mutual Fund Performance' published in the Journal of Business. It became one of the most widely used metrics in professional investment management.
Can the Sharpe ratio be negative?
Yes. A negative Sharpe ratio means the investment returned less than the risk-free rate — that is, you would have been better off putting your money in cash. Any investment with a negative Sharpe ratio is destroying risk-adjusted value. On the GIP framework, any stock with a negative Sharpe ratio is immediately excluded from the Approved List regardless of how attractive other metrics might appear.
Where can I find Sharpe ratio data for individual stocks?
Sharpe ratio data for individual stocks and funds is available on Bloomberg, Morningstar, and Stockopedia. Morningstar publishes Sharpe ratios for funds on its free UK platform. For individual stocks, the calculation requires historical return and volatility data, which most free platforms do not publish in ratio form. The GIP Approved List pre-calculates Sharpe for all 8,000 stocks in the investable universe weekly. Details at alpeshpatel.com/shares.
Is the Sharpe ratio or the Sortino ratio more important?
For individual investors focused on capital protection, the Sortino ratio is more practically relevant because it isolates downside risk specifically. For academic and institutional comparison purposes, the Sharpe ratio is more universally used. The GIP framework uses both — the Sharpe ratio for its universality and comparability, and the Sortino ratio for its investor-relevant precision. Neither is more important; they answer different questions and together give the most complete picture.
To understand how the complete GIP five-metric framework works in practice and how to apply it to your own SIPP and ISA portfolio, book a free portfolio review here.
Sources & Further Reading
Sharpe, W.F. (1966) — 'Mutual Fund Performance'. Journal of Business, 39(1). Original publication introducing the Sharpe ratio. jstor.org/stable/2351741
Sortino, F.A. & van der Meer, R. (1991) — 'Downside Risk'. Journal of Portfolio Management. Introducing the Sortino ratio as a complement to Sharpe. pm-research.com/content/iijpormgmt/17/4/27
AQR Capital Management — Research on risk-adjusted return metrics and factor investing. aqr.com/insights/research
Morningstar UK — Sharpe ratio data, fund performance, and risk-adjusted return analysis. morningstar.co.uk
Financial Times — Quantitative investing, risk-adjusted return, and fund performance analysis. ft.com/investing
Disclaimer: This article is for educational purposes only and does not constitute personal financial guidance or a recommendation to buy or sell any investment. All investing carries risk. Past performance is not a reliable indicator of future results.
Alpesh Patel OBE


Comments