Comprehensive 3-Year Outlook: US, UK, and European Equities (2026-2029)
- Alpesh Patel
- 5 days ago
- 3 min read

Updated: 2 days ago
European equities offer the most compelling 3-year risk-adjusted returns driven by German fiscal stimulus and valuation recovery, while US equities face high-valuation constraints dependent on AI earnings delivery. UK equities provide selective value with mid-single-digit returns but structural headwinds persist.
Executive Summary
The STOXX 600 trades at approximately 15x forward earnings, representing a 50% discount to US valuations that stands at its widest level in two decades. Germany’s €500 billion infrastructure and defence spending package represents a fundamental break with fiscal orthodoxy that has constrained European demand since 2010.
Key return forecasts: Europe base case ~9% annualised | US base case 6-9% annualised | UK base case 5-7% annualised.

US Equities 3-year outlook: High-Valuation Constraints
The S&P 500’s forward price-to-earnings ratio of approximately 30x places it in the 95th percentile of historical valuations, approached only during the internet bubble of 1999-2000.
The ‘Magnificent 7’ account for 36% of index market capitalisation and are projected to deliver 23.4% earnings growth, while the remaining 493 constituents achieve 13.2% growth.
US Return Scenarios (2026-2029): Base Case (55% probability) — 6-9% annually. Bull Case (25%) — 12-15% annually. Bear Case (20%) — -5% to +2% annually.

UK Equities 3-year outlook: Selective Value Opportunities
The UK occupies an intermediate position in the regional hierarchy, offering genuine value opportunities alongside significant structural constraints. The FTSE 100 has achieved multiple record highs in 2025, driven by performance in HSBC, AstraZeneca, and Rolls-Royce, yet the index continues to trade at a substantial discount to global peers.
Structural challenges include post-Brexit productivity gaps, limited fiscal space, political volatility, and limited tech representation.

However, opportunities exist in large-cap value discounts, sterling weakness benefits, mid-cap recovery potential, and global multinationals. The FTSE 100 target of 10,750 implies approximately 7% price appreciation with dividend yields of 3.5-4.0% providing additional total return.
European Equities 3-year outlook: Cyclical Outperformance
European equities enter 2026 with the most favourable combination of valuation support, earnings momentum, and policy catalysts among developed markets.

Germany’s €500 billion fiscal package includes €300bn in infrastructure investment and €200bn in defence and security spending, front-loaded for implementation. The economic impact is estimated at +0.5% GDP growth annually with multi-year construction demand and supply chain multiplier effects.
Barclays Return Scenarios: Bull Case (25%) — STOXX 600 at 700, ~20% annual return. Base Case (50%) — STOXX 600 at 620, ~9% annual return with 8% EPS growth. Bear Case (25%) — STOXX 600 at 475, ~-17% annual return if AI bubble bursts or policy error occurs.
Macroeconomic Outlook by Region
United States: GDP Growth 2.8% (2026), Core PCE Inflation 2.2%, Policy Rate 3.50%. United Kingdom: GDP Growth 1.5%, CPI Inflation 2.2%, Bank Rate 3.75%. Euro Area: GDP Growth 1.3%, HICP Inflation 1.9%, ECB Rate 1.75%.
Key macro drivers include the AI infrastructure investment cycle ($485-515 billion hyperscaler capex in 2026) and central bank policy divergence. The Federal Reserve sits at 4.25-4.50%, the ECB at 2.50%, and the Bank of England at 4.50% — each on different normalisation trajectories creating regional opportunities and currency effects.
Sector & Industry Focus

US Sector Positioning: Most Favoured: Information Technology, Health Care (GLP-1), Industrials (defence). More Favoured: Communication Services, Consumer Discretionary (premium). Neutral: Financials, Materials. Less Favoured: Real Estate, Utilities. Least Favoured: Energy, Consumer Staples.
European themes: Overweight cyclicals (banks and industrials benefiting from German stimulus), AI infrastructure (semiconductor equipment such as ASML and data centre developers), and strategic autonomy (defence and critical raw materials).
UK opportunities: Financials (Aviva, Prudential), Health Care (AstraZeneca, GSK), and Energy & Materials (diversified miners leveraged to green transition commodity demand).
Risk Assessment & Scenario Triggers
Common global risks in the 3-year outlook include AI investment cycle disappointment (25-30% probability), geopolitical escalation in Ukraine, Middle East, and Taiwan (20-25%), and central bank policy errors (15-20%).

US-specific risks: Magnificent 7 concentration (30-35%), fiscal sustainability concerns (20-25%). UK-specific: gilt market instability (25-30%), Brexit trade friction (20-25%). Europe-specific: German fiscal implementation delays (25-30%), China exposure (20-25%).
Strategic Asset Allocation Implications
Europe: Overweight - valuation recovery, cyclical acceleration, German fiscal stimulus creating multiple expansion opportunities. Implementation via STOXX 600 or country-specific ETFs with active management for stock selection.
US: Quality Focus - high valuation and concentration risk requires earnings resilience and selective exposure. Implementation via S&P 493 equal-weight, quality factor, and sector selection.
UK: Selective Overweight - large-cap value and mid-cap domestic recovery optionality with controlled risk. Implementation via FTSE 100 dividend-focused and FTSE 250 active management.
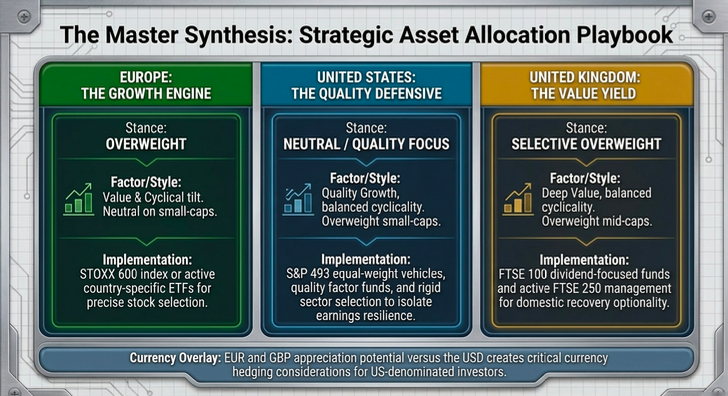
Style and factor positioning: favour value in Europe and UK, quality growth in US. Overweight small-caps in US/UK, neutral in Europe. Cyclical tilt in Europe, balanced in US/UK. EUR and GBP appreciation potential versus USD creates currency hedging considerations.
Investment analysis based on research from leading financial institutions and market data providers. March 2026.
Want guidance building a portfolio using these insights? Join the Great Investments Programme at alpeshpatel.com/shares or visit campaignforamillion.com Alpesh Patel OBE


Comments