September’s Shadow on Wall Street: Lessons for Building Long-Term Wealth
- Alpesh Patel
- Sep 7, 2025
- 7 min read

Every September, like clockwork, my inbox fills with the same worried question:
“Alpesh, is this the month markets finally crack?”
It’s a fair concern. If you’ve been investing long enough, you know September carries a reputation - not of pumpkin spice and autumn leaves, but of volatility, red screens, and investor unease. It’s been called Wall Street’s “jinx month,” the “graveyard of summer rallies,” and the “September Effect.”
But here’s the twist: while September often delivers turbulence, it also offers valuable lessons for wealth builders. Lessons about discipline, psychology, compounding, and why temporary setbacks don’t derail long-term success.
This article is my attempt to walk you through those lessons - with hard data, historical examples, and actionable insights. Think of it as a toolkit for surviving September (and thriving beyond it).
Grab a strong coffee. Let’s go deep.
The Evidence: September’s Track Record
Let’s begin with the hard numbers.

Source: Bloomberg, Markets Live Data on S&P 500 Seasonal Performance
The chart above shows the S&P 500’s September returns from 2015 through 2024. It’s a sobering picture:
2015: –2.6%. Investors grappled with fears of a China slowdown and Fed rate hike speculation.
2016: –0.1%. A quiet but flat September, as the U.S. election cycle loomed.
2017: +1.9%. A rare bright spot, fueled by optimism in global synchronized growth.
2018: +0.4%. Mildly positive, but tensions over trade tariffs simmered beneath the surface.
2019: +1.7%. A relief rally amid easing trade war rhetoric.
2020: –3.9%. COVID aftershocks and uncertainty over vaccine progress triggered a pullback.
2021: –4.8%. Inflation worries and taper talk from the Fed spooked investors.
2022: –9.3%. A brutal month as interest rates surged and recession fears dominated.
2023: –4.9%. Tech valuations compressed under the weight of higher-for-longer rates.
2024: +2.0%. A rebound year, but the scars of past Septembers still fresh.
That’s the pattern in a nutshell: a few decent years, surrounded by sharp declines. If you’ve been invested during this period, you know September doesn’t forgive complacency.
Zooming Out: The Long-Term Data
Now let’s step back.

Source: Bloomberg, 20-Year Monthly Performance Analysis of the S&P 500
Over the last two decades, September stands out as the only month with negative average returns (–0.7%). Compare this with:
April (+1.8%): fueled by strong earnings seasons.
July (+2.5%): often the strongest month, as mid-year optimism takes hold.
November (+2.3%): driven by holiday spending and year-end positioning.
This isn’t a quirk of the 2010s or 2020s. Average Monthly Returns Since 1928 (Motley Fool): Shows September as the weakest month.

The “September Effect” stretches back almost a century. Since 1928, the S&P 500 has averaged a –1.1% return in September, making it the weakest month of the year. More importantly, September has produced more losing years (53) than winning years (43) — a statistical outlier compared to every other month.
But to truly appreciate how persistent this pattern is, we need to zoom out even further. The Visual Capitalist chart below, drawing on YCharts data since 1950.

This reinforces the same story across seven decades: September is the only month with negative average returns (–0.72%). While months like April, July, November, and December consistently deliver gains. What makes this so powerful is the consistency - whether we look at 20 years, 50 years, or nearly a century of data, September repeatedly emerges as the weakest link in the calendar.
Why September Struggles
The question is: why? Why has one month, across generations, earned such a poor reputation?
Institutional Flows
September is fiscal year-end for many mutual funds. That means managers sell holdings to lock in gains, rebalance portfolios, and harvest tax losses. When trillions move in and out of equities, markets wobble.
Investor Psychology
There’s a behavioural finance angle too. After the summer lull, traders and investors return in September with a sharper focus on risks: Fed policy, budget deadlines, earnings warnings. Fear and caution dominate — and markets reflect that mood.
Macro Triggers
Some of the worst market events in history happened in September:
Lehman Brothers collapsed (September 2008).
The 9/11 attacks (September 2001).
Black Wednesday in the UK (September 1992).
History has a way of reinforcing psychological biases. September feels dangerous because it often has been.
Academic Insights
Economists call this a “calendar anomaly.” Just like the “January Effect” (small-cap rallies) or “Sell in May” (summer weakness), September’s struggles have been studied in journals and hedge fund research. Some attribute it to reporting cycles, others to investor sentiment. The debate rages, but the numbers are hard to ignore.
Case Studies: When September Bites

Win Rate vs Average Return Chart: Highlights how September underperforms both in magnitude and frequency.
To truly appreciate the September Effect, let’s revisit three case studies.
2008: The Financial Crisis Peaks
September 2008 was catastrophic. Lehman collapsed, AIG required a bailout, and the global banking system teetered. The S&P 500 fell nearly 9% that month alone. Panic gripped markets.
But here’s the lesson: by March 2009, the bear market had bottomed. Over the next decade, investors who stayed invested saw one of the greatest bull runs in history.
2000–2002: The Dot-Com Bust
September repeatedly delivered pain during the early 2000s tech bubble burst. Overvalued internet stocks collapsed, wiping out trillions. Yet those who held quality businesses (or re-entered the market) participated in the massive mid-2000s rally that followed.
2020: Pandemic Volatility
After a sharp rebound from March’s crash, September 2020 reminded investors that uncertainty lingers. The S&P fell 3.9% as vaccine doubts, political tensions, and tech valuations weighed. Yet just months later, markets roared back to record highs.
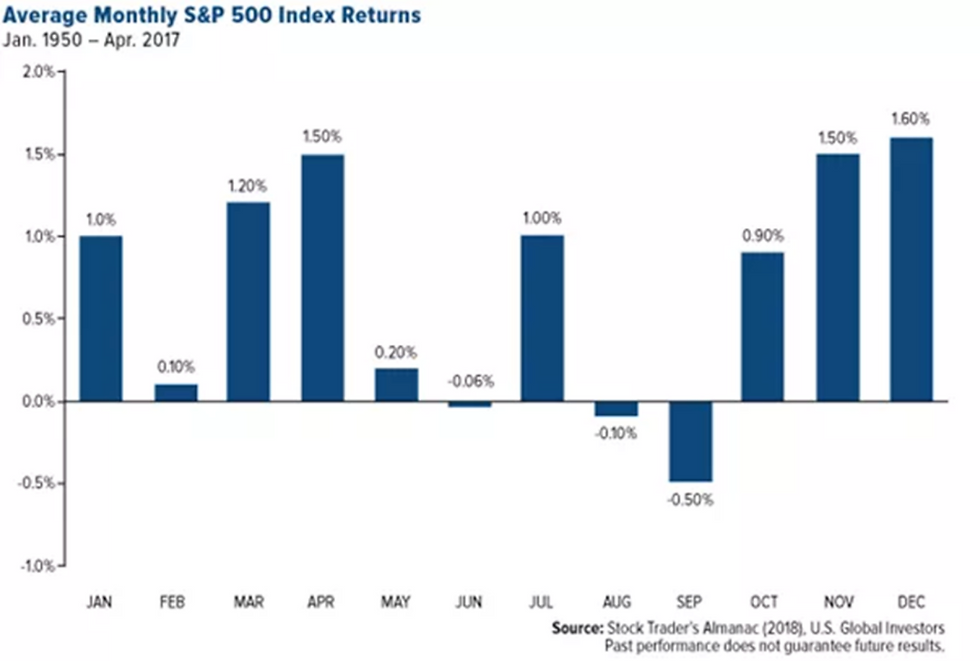
The lesson? September may be rough, but it rarely changes the long-term trajectory of markets. Best & Worst Months (1950–2017): Demonstrates that August and September consistently lag. Average Monthly S&P 500 Returns 1950–2017 (Stock Trader’s Almanac)
The Tactical Investor’s Playbook
So, how should you approach September as an investor?
Expect Volatility, Don’t Fear It
Knowledge turns fear into preparation. If you know September is historically weak, a few red days won’t rattle you.
Stick to the Big Picture
The S&P 500 has delivered:
+69% chance of gains over 1 year
+88% over 10 years
+100% over rolling 20-year periods
That’s the magic of compounding. September’s dips are temporary noise.
Use September to Buy, Not Sell
Corrections are chances to accumulate. Buffett’s advice applies here: “Be greedy when others are fearful.”
Seasonal Strategies
Some traders avoid September entirely. Research from Jay Kaeppel showed that skipping the month and re-entering in October dramatically boosted long-term returns. That’s not advice to sell everything, but it illustrates how reliable the pattern can be.
Diversify Smartly
September corrections tend to hit broad indices hardest. Rotating into defensive sectors (healthcare, utilities) or diversifying globally can help smooth volatility.
Heatmap of Monthly Returns: Vividly shows September “in the red” across decades.

A bird’s-eye view of the last three decades: notice how September repeatedly flashes red, reinforcing its reputation as Wall Street’s most difficult month.
September 2025: This Year’s Unique Risks
What makes September 2025 special?
Trade Tariffs: New tariffs have rattled supply chains, creating uncertainty in corporate earnings.
Fed Independence Under Pressure: Political meddling in central banking creates unease for global markets.
Earnings at High Altitude: Corporate profits remain strong, but valuations are stretched - any disappointment could spark sell-offs.
In other words, September 2025 is shaping up to be “classic September”: volatility at high altitude.
But here’s the important reminder - every past September looked scary too. And yet, over time, markets powered through.
The Campaign for a Million Takeaway
Building a million-pound (or million-dollar) portfolio isn’t about avoiding bad months. It’s about discipline, compounding, and perspective.
September teaches us three lessons:
Markets aren’t straight lines. Dips happen.
Fear is temporary. Long-term compounding is permanent.
Knowledge creates confidence. If you expect volatility, it can’t shake you.
So, don’t fear September. Anticipate it. Use it. And above all — stay invested.
Because when you zoom out, September isn’t the graveyard of wealth. It’s the proving ground of patience. Sources
Investopedia – “History Says Sell in September. Wall Street Says Keep Buying” (2023)
Reuters – “Anxious Wall Street Braces for Jumbo September Effect” (2025)
Barron’s – “September’s Stock Market Reputation May Hold True Again” (2025)
MarketWatch – “Should Stock Market Bulls Just Sit Out September Slumps?” (2024)
Kiplinger – “Stocks Slide to Start September” (2025)
Nasdaq – “Here’s the Average Stock Market Return in Every Month of the Year” (2023)
The Motley Fool – “Average Monthly Returns Since 1928” (2024)
The Robust Trader – “Best and Worst Months for the Stock Market” (2017)
Disclaimer
The information provided in this article is for educational purposes only and is not intended as investment advice or a recommendation to buy or sell any financial instrument. Past performance is not a reliable indicator of future results. The value of investments can go down as well as up, and you may not get back the amount you originally invested.
All views expressed are my own and do not constitute personalised financial advice. You should consider whether any investment is suitable for your circumstances and, if necessary, seek independent financial advice from a professional regulated by the Financial Conduct Authority (FCA).
Investing involves risk. Capital is at risk.
Alpesh B Patel OBE
www.campaignforamillion.com


Comments